
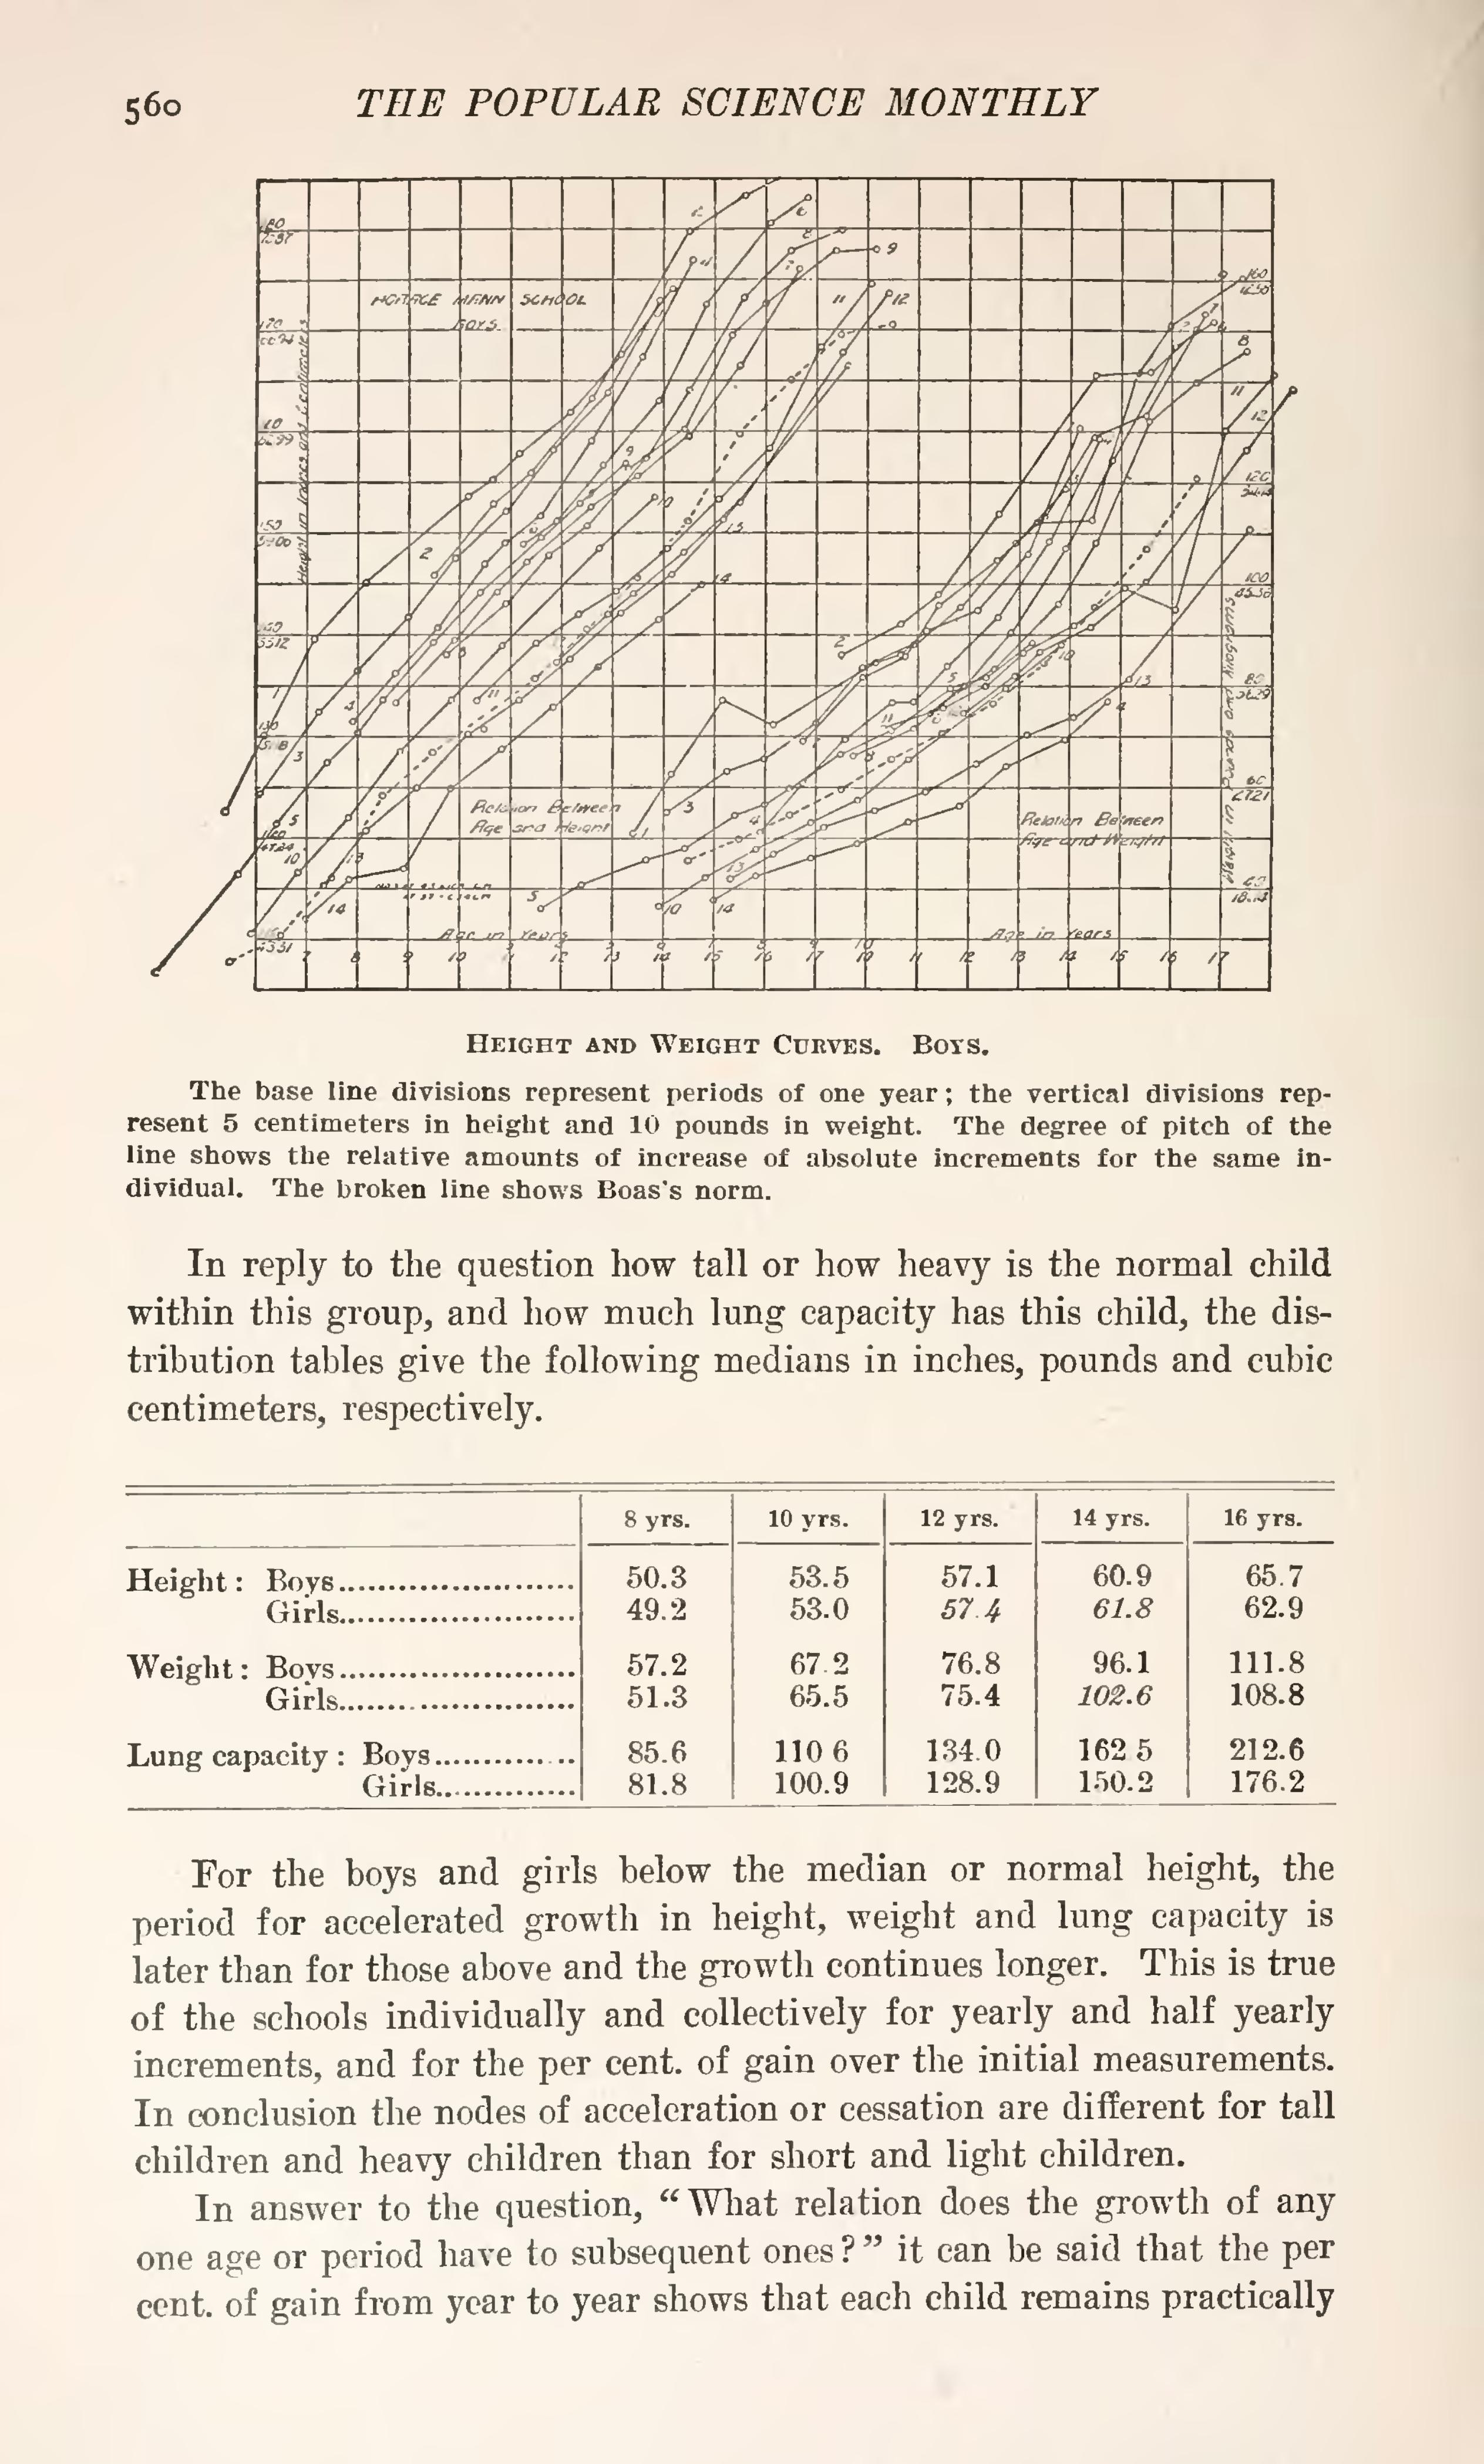
The base line divisions represent periods of one year; the vertical divisions represent 5 centimeters in height and 10 pounds in weight. The degree of pitch of the line shows the relative amounts of increase of absolute increments for the same individual. The broken line shows Boas's norm.
In reply to the question how tall or how heavy is the normal child within this group, and how much lung capacity has this child, the distribution tables give the following medians in inches, pounds and cubic centimeters, respectively.
| 8 yrs. | 10 yrs. | 12 yrs. | 14 yrs. | 16 yrs. | ||
| Height: Boys | 50.3 | 53.5 | 57.1 | 60.9 | 65.7 | |
| Girls | 49.2 | 53.0 | 57.4 | 61.8 | 62.9 | |
| Weight: Boys | 57.2 | 67.2 | 76.8 | 96.1 | 111.8 | |
| Girls | 51.3 | 65.5 | 75.4 | 102.6 | 108.8 | |
| Lung capacity: Boys | 85.6 | 110.6 | 134.0 | 162.5 | 212.6 | |
| Girls | 81.8 | 100.9 | 128.9 | 150.2 | 176.2 | |
For the boys and girls below the median or normal height, the period for accelerated growth in height, weight and lung capacity is later than for those above and the growth continues longer. This is true of the schools individually and collectively for yearly and half yearly increments, and for the per cent, of gain over the initial measurements. In conclusion the nodes of acceleration or cessation are different for tall children and heavy children than for short and light children.
In answer to the question, "What relation does the growth of any one age or period have to subsequent ones?" it can be said that the per cent, of gain from year to year shows that each child remains practically
