THE SOCIAL MARKING SYSTEM
737
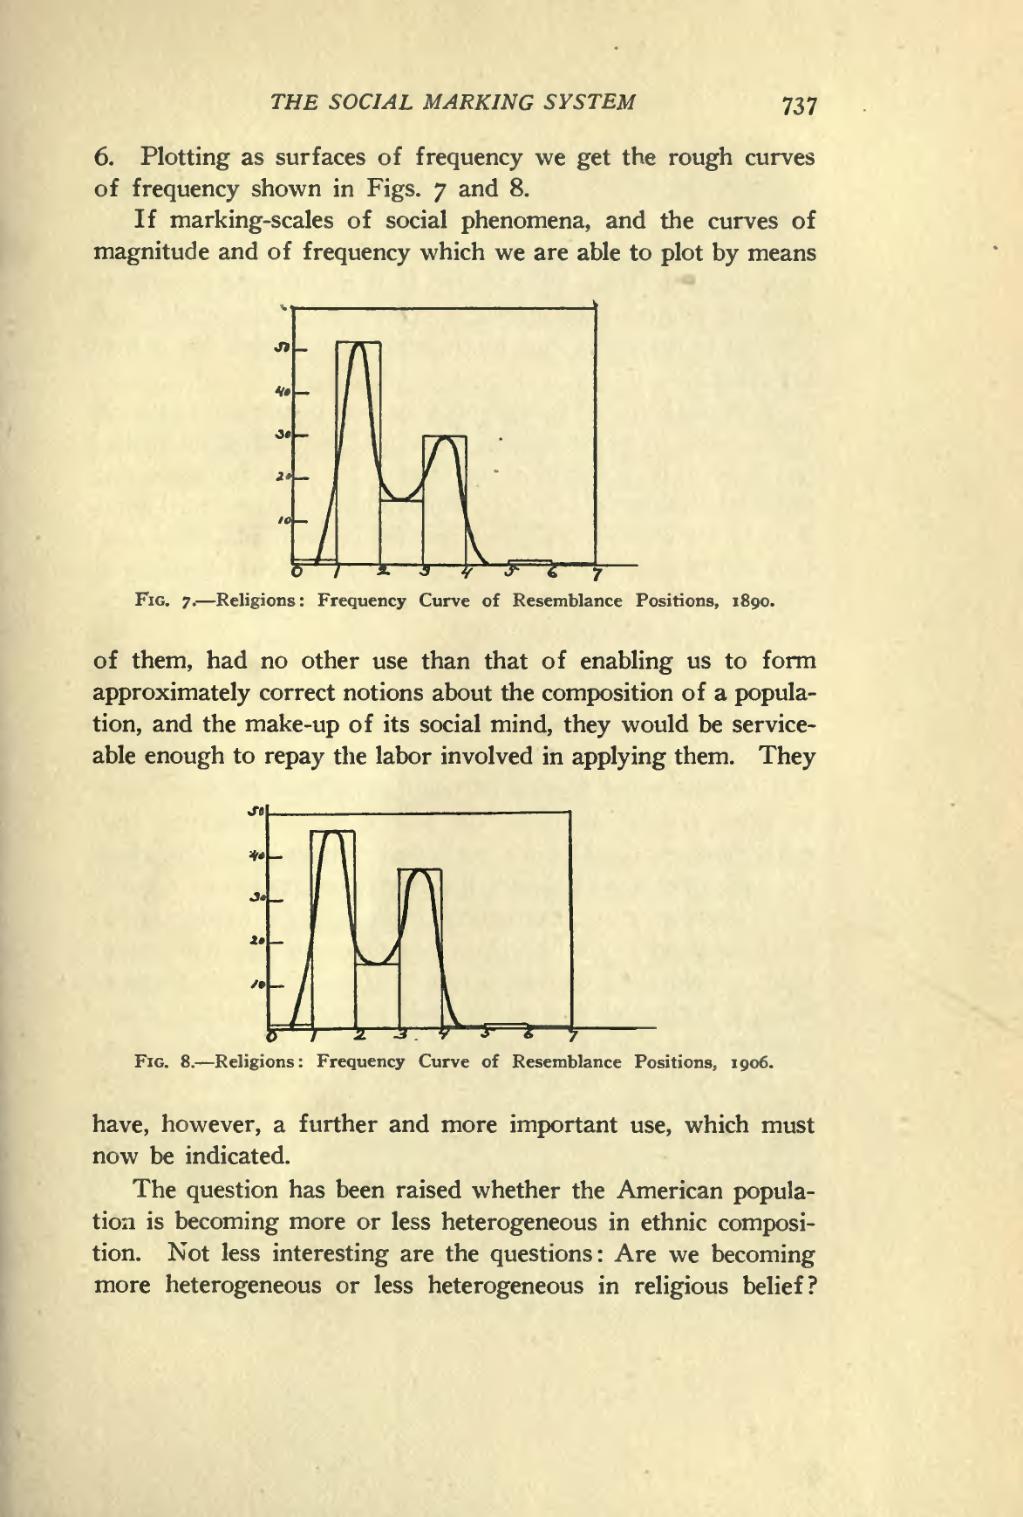
6. Plotting as surfaces of frequency we get the rough curves of frequency shown in Figs. 7 and 8.
If marking-scales of social phenomena, and the curves of magnitude and of frequency which we are able to plot by means
Fig. 7. — Religions : Frequency Curve of Resemblance Positions, 1890.
of them, had no other use than that of enabling us to form approximately correct notions about the composition of a popula- tion, and the make-up of its social mind, they would be service- able enough to repay the labor involved in applying them. They
ir-^ S — -^. V J- i y
Fig. 8. — Religions: Frequency Curve of Resemblance Positions, 1906.
have, however, a further and more important use, which must now be indicated.
The question has been raised whether the American popula- tion is becoming more or less heterogeneous in ethnic composi- tion. Not less interesting are the questions: Are we becoming more heterogeneous or less heterogeneous in religious belief?