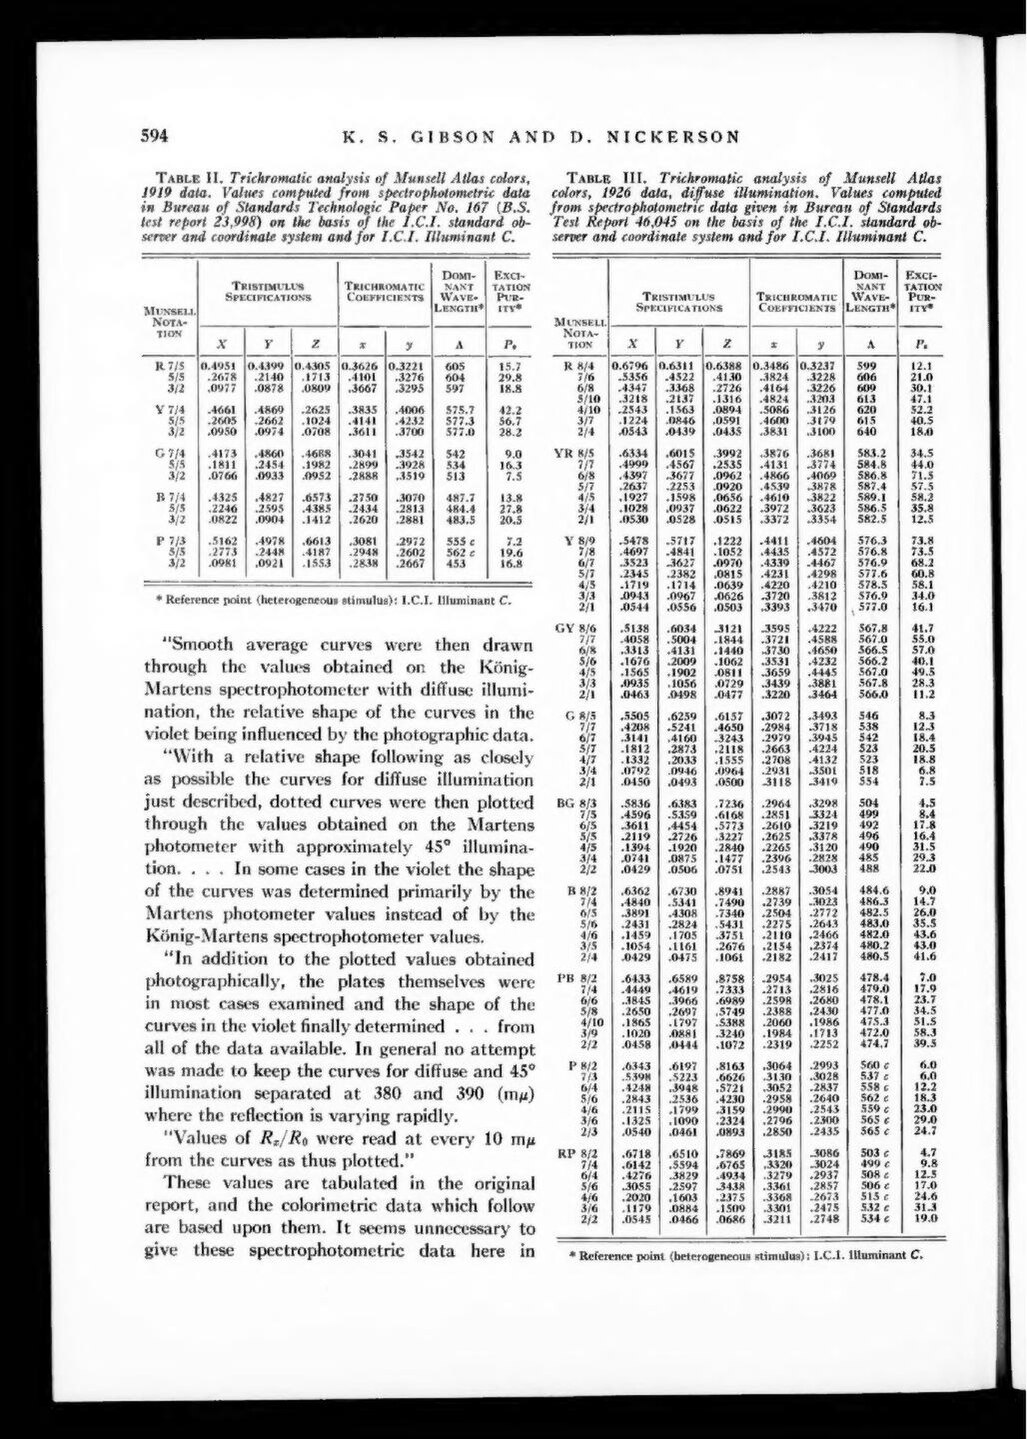
Table II. Trichromatic analysis of Munsell Atlas colors,1919 data. Values computed from spectrophotometric data in Bureau of Standards Technologic Paper No. 167 (B.S. test report 23,998) on the basis of the I.C.I. standard observer and coordinate system and for I.C.I. Illuminant C.
| Munsell Notation |
Tristimulus Specifcations |
Trichromatic Coefficients |
Dominant Wave-Length* | Excitation Purity* | ||||
| X | Y | Z | x | y | Λ | |||
| R | 7/5 | 0.4951 | 0.4399 | 0.4305 | 0.3626 | 0.3221 | 605 | 15.7 |
| 5/5 | .2678 | .2140 | .1713 | .4101 | .3276 | 604 | 29.8 | |
| 3/2 | .0977 | .0878 | .0809 | .3667 | .3295 | 597 | 18.8 | |
| Y | 7/4 | .4661 | .4869 | .2625 | .3835 | .4006 | 577.5 | 42.2 |
| 5/5 | .2605 | .2662 | .1024 | .4141 | .4232 | 577.3 | 56.7 | |
| 3/2 | .0950 | 0974 | .0708 | .3611 | .3700 | 577.0 | 28.2 | |
| G | 7/4 | .4173 | .4860 | .4688 | .3041 | .3542 | 542 | 9.0 |
| 8/5 | .1811 | .2454 | .1982 | .2899 | .3928 | 534 | 16.3 | |
| 3/2 | .0766 | .0933 | .0952 | .2888 | .3519 | 513 | 7.5 | |
| R | 7/4 | .4325 | .4827 | .6573 | .2750 | .3070 | 487.7 | 13.8 |
| 5/5 | .2246 | .2595 | .4385 | .2434 | .2813 | 484.4 | 27.8 | |
| 3/2 | .0822 | .0904 | .1412 | .2620 | .2881 | 483.5 | 20.5 | |
| P | 7/3 | .5162 | .4978 | .6613 | .3081 | .2972 | 555 c | 7.2 |
| 5/5 | .2773 | .2448 | .4187 | .2948 | .2602 | 562 c | 19.6 | |
| 3/2 | .0981 | .0921 | .1553 | .2838 | .2667 | 453 | 16.8 | |

* Reference point (heterogeneous stimulus): I.C.I. Iluminant C.
“Smooth average curves were then drawn through the values obtained on the König-Martens spectrophotometer with diffuse illumination, the relative shape of the curves in the violet being influenced by the photographic data.
“With a relative shape following as closely as possible the curves for diffuse illumination just described, dotted curves were then plotted through the values obtained on the Martens photometer with approximately 45° illumination. . . . In some cases in the violet the shape of the curves was determined primarily by the Martens photometer values instead of by the König-Martens spectrophotometer values.
“In addition to the plotted values obtained photographically, the plates themselves were in most cases examined and the shape of the curves in the violet finally determined . . . from all of the data available. In general no attempt was made to keep the curves for diffuse and 45° illumination separated at 380 and 390 (mμ) where the reflection is varying rapidly.
Table III. Trichromatic analysis of Munsell Atlas colors, 1926 data, diffuse illumination. Values computed from spectrophotometric data given in Bureau of Standards Test Report 46,045 on the basis of the I.C.I. standard observer and coordinate system and for I.C.I. Illuminant C.
| Munsell Notation |
Tristimulus Specifcations |
Trichromatic Coefficients |
Dominant Wave-Length* | Excitation Purity* | ||||
| X | Y | Z | x | y | Λ | |||
| R | 8/4 | 0.6796 | 0.6311 | 0.6388 | 0.3486 | 0.3237 | 599 | 12.1 |
| 7/6 | .5336 | .4522 | .4130 | .3824 | .3228 | 606 | 21.0 | |
| 6/8 | .4347 | .3368 | -2726 | .4164 | .3226 | 600 | 30.1 | |
| 5/10 | .3218 | .2137 | .1316 | .4824 | .3203 | 613 | 47.1 | |
| 4/10 | .2543 | .1363 | .0894 | .5086 | .3126 | 620 | 52.2 | |
| 3/7 | .1224 | .0846 | .0591 | .4600 | .3179 | 615 | 40.5 | |
| 2/4 | .0543 | .0439 | .0435 | .3831 | .3100 | 640 | 18.0 | |
| YR | 8/5 | .6334 | .6015 | .3992 | .3876 | .3681 | 583.2 | 34.5 |
| 7/7 | .4999 | .4567 | .2535 | .4131 | .3774 | 584.8 | 44.0 | |
| 6/8 | .4397 | .3677 | .0962 | .4866 | .4069 | 586.8 | 71.5 | |
| 5/7 | .2637 | .2253 | .0920 | .4539 | .3878 | 587.4 | 57.5 | |
| 4/5 | .1927 | .1598 | .0656 | .4610 | .3822 | 589.1 | 58.2 | |
| 3/4 | .1028 | .0937 | .0622 | .3972 | .3623 | 586.5 | 35.8 | |
| 2/1 | .0530 | .0528 | .0515 | .3372 | .3354 | 582.5 | 12.5 | |
| Y | 8/9 | .5478 | .5717 | .1222 | .4411 | .4604 | 576.3 | 73.8 |
| 7/8 | .4697 | .4841 | .1052 | .4435 | .4572 | 576.8 | 73.5 | |
| 6/7 | .3523 | .3627 | .0970 | .4339 | .4467 | 576.9 | 68.2 | |
| 5/7 | .2345 | .2382 | .0815 | .4231 | .4298 | 577.6 | 60.8 | |
| 4/5 | .1719 | .1214 | .0639 | .4220 | .4210 | 578.5 | 58.1 | |
| 3/3 | .0943 | .0967 | .0626 | .3720 | .3812 | 576.9 | 34.0 | |
| 2/1 | .0544 | .0556 | .0503 | .3393 | .3470 | 577.0 | 16.1 | |
| GY | 8/6 | .5138 | .6034 | .3121 | .3595 | .4222 | 567.8 | 41.7 |
| 7/7 | .4058 | .5004 | .1844 | .3721 | .4588 | 567.0 | 55.0 | |
| 6/8 | .3313 | .4131 | .1440 | .3730 | .4650 | 366.5 | 57.0 | |
| 5/6 | .1676 | .2009 | .1062 | .3531 | .4232 | 566.2 | 40.1 | |
| 4/5 | .1565 | .1902 | .0811 | .3659 | .4445 | 567.0 | 49.5 | |
| 3/3 | .0935 | .1056 | .0729 | .3439 | .3881 | 567.8 | 28.3 | |
| 2/1 | .0463 | .0498 | .0477 | .3220 | .3464 | 566.0 | 11.2 | |
| G | 8/5 | .5505 | .6259 | .6157 | .3072 | .3493 | 546 | 8.3 |
| 7/7 | .4208 | .5241 | .4650 | .2984 | .3718 | 538 | 12.3 | |
| 6/7 | .3141 | .4160 | .3243 | .2979 | .3945 | 542 | 18.4 | |
| 5/7 | .1812 | .2873 | .2118 | .2663 | .4224 | 523 | 20.5 | |
| 4/7 | .1332 | .2033 | .1555 | .2708 | .4132 | 523 | 18.8 | |
| 3/4 | .0792 | .0946 | .0964 | .2931 | .3501 | 518 | 6.8 | |
| 2/1 | .0450 | .0493 | .0500 | .3118 | .3419 | 554 | 7.5 | |
| BG | 8/3 | .5836 | .6383 | .7236 | .2964 | .3298 | 504 | 4.5 |
| 7/5 | .4596 | .5.359 | .6168 | .2851 | .3324 | 499 | 8.4 | |
| 6/5 | .3611 | .4454 | .5773 | .2610 | .3219 | 492 | 17.8 | |
| 5/5 | .2119 | .2726 | .3227 | .2625 | .3378 | 496 | 16.4 | |
| 4/5 | .1394 | .1920 | .2840 | .2265 | .3120 | 490 | 31.5 | |
| 3/4 | .0741 | .0875 | .1477 | .2396 | .2828 | 485 | 29.3 | |
| 2/2 | .0429 | .0506 | .0751 | .2543 | .3003 | 488 | 22.0 | |
| B | 8/2 | .6362 | .6730 | .8941 | .2887 | .3054 | 484.6 | 9.0 |
| 7/4 | .4840 | .5341 | .7490 | .2739 | .3023 | 486.3 | 14.7 | |
| 6/5 | .3891 | .4308 | .7340 | .2504 | .2772 | 482.5 | 26.0 | |
| 5/6 | .2431 | .2824 | .5431 | .2275 | .2643 | 483.0 | 35.5 | |
| 4/6 | .1459 | .1705 | .3751 | .2110 | .2466 | 482.0 | 43.6 | |
| 3/5 | .1054 | .1161 | .2676 | .2154 | .2374 | 480.2 | 43.0 | |
| 2/4 | .0429 | .0475 | .1061 | .2182 | .2417 | 480.5 | 41.6 | |
| PB | 8/2 | .6433 | .6589 | .8758 | .2954 | .3025 | 478.4 | 7.0 |
| 7/4 | .4449 | .4619 | .7333 | .2713 | .2816 | 479.0 | 17.9 | |
| 6/6 | .3845 | .3966 | .6989 | .2598 | .2680 | 478.1 | 23.7 | |
| 5/8 | .2650 | .2697 | .5749 | .2388 | .2430 | 477.0 | 34.5 | |
| 4/10 | .1865 | .1797 | .5388 | .2060 | .1986 | 475.3 | 51.5 | |
| 3/9 | .1020 | .0881 | .3240 | .1984 | .1713 | 472.0 | 58.3 | |
| 2/2 | .0458 | .0444 | .1072 | .2319 | .2252 | 474.7 | 39.5 | |
| P | 8/2 | .6343 | .6197 | .8163 | .3064 | .2993 | 560 c | 6.0 |
| 7/3 | .5398 | .5223 | .6626 | .3130 | .3028 | 537 c | 6.0 | |
| 6/4 | .4248 | .3948 | .5721 | .3052 | .2837 | 558 c | 12.2 | |
| 5/6 | .2843 | .2536 | .4230 | .2958 | .2640 | 562 c | 18.3 | |
| 4/6 | .2115 | .1799 | .3159 | .2990 | .2543 | 559 c | 23.0 | |
| 3/6 | .1325 | .1090 | .2324 | .2796 | .2300 | 565 c | 29.0 | |
| 2/3 | .0540 | .0461 | .0893 | .2850 | .2435 | 565 c | 24.7 | |
| RP | 8/2 | .6718 | .6510 | .7869 | .3185 | .3086 | 503 | c 4.7 |
| 7/4 | .6142 | .5594 | .6765 | .3320 | .3024 | 499 | c 9.8 | |
| 6/4 | .4276 | .3829 | .4934 | .3279 | .2937 | 508 c | 12.5 | |
| 5/6 | .3055 | .2597 | .3438 | .3361 | .2857 | 506 c | 17.0 | |
| 4/6 | .2020 | .1603 | .2375 | .3368 | .2673 | 515 c | 24.6 | |
| 3/6 | 1179 | .0884 | .1509 | .3301 | .2475 | 532 c | 31.3 | |
| 2/2 | .0545 | .0466 | .0686 | 3211 | .2748 | 534 c | 19.0 | |
* Reference point (beterogeneous stimulus): I.C.I. Illuminant C.
“Values of were read at every 10 mμ from the curves as thus plotted.”

