This page needs to be proofread.
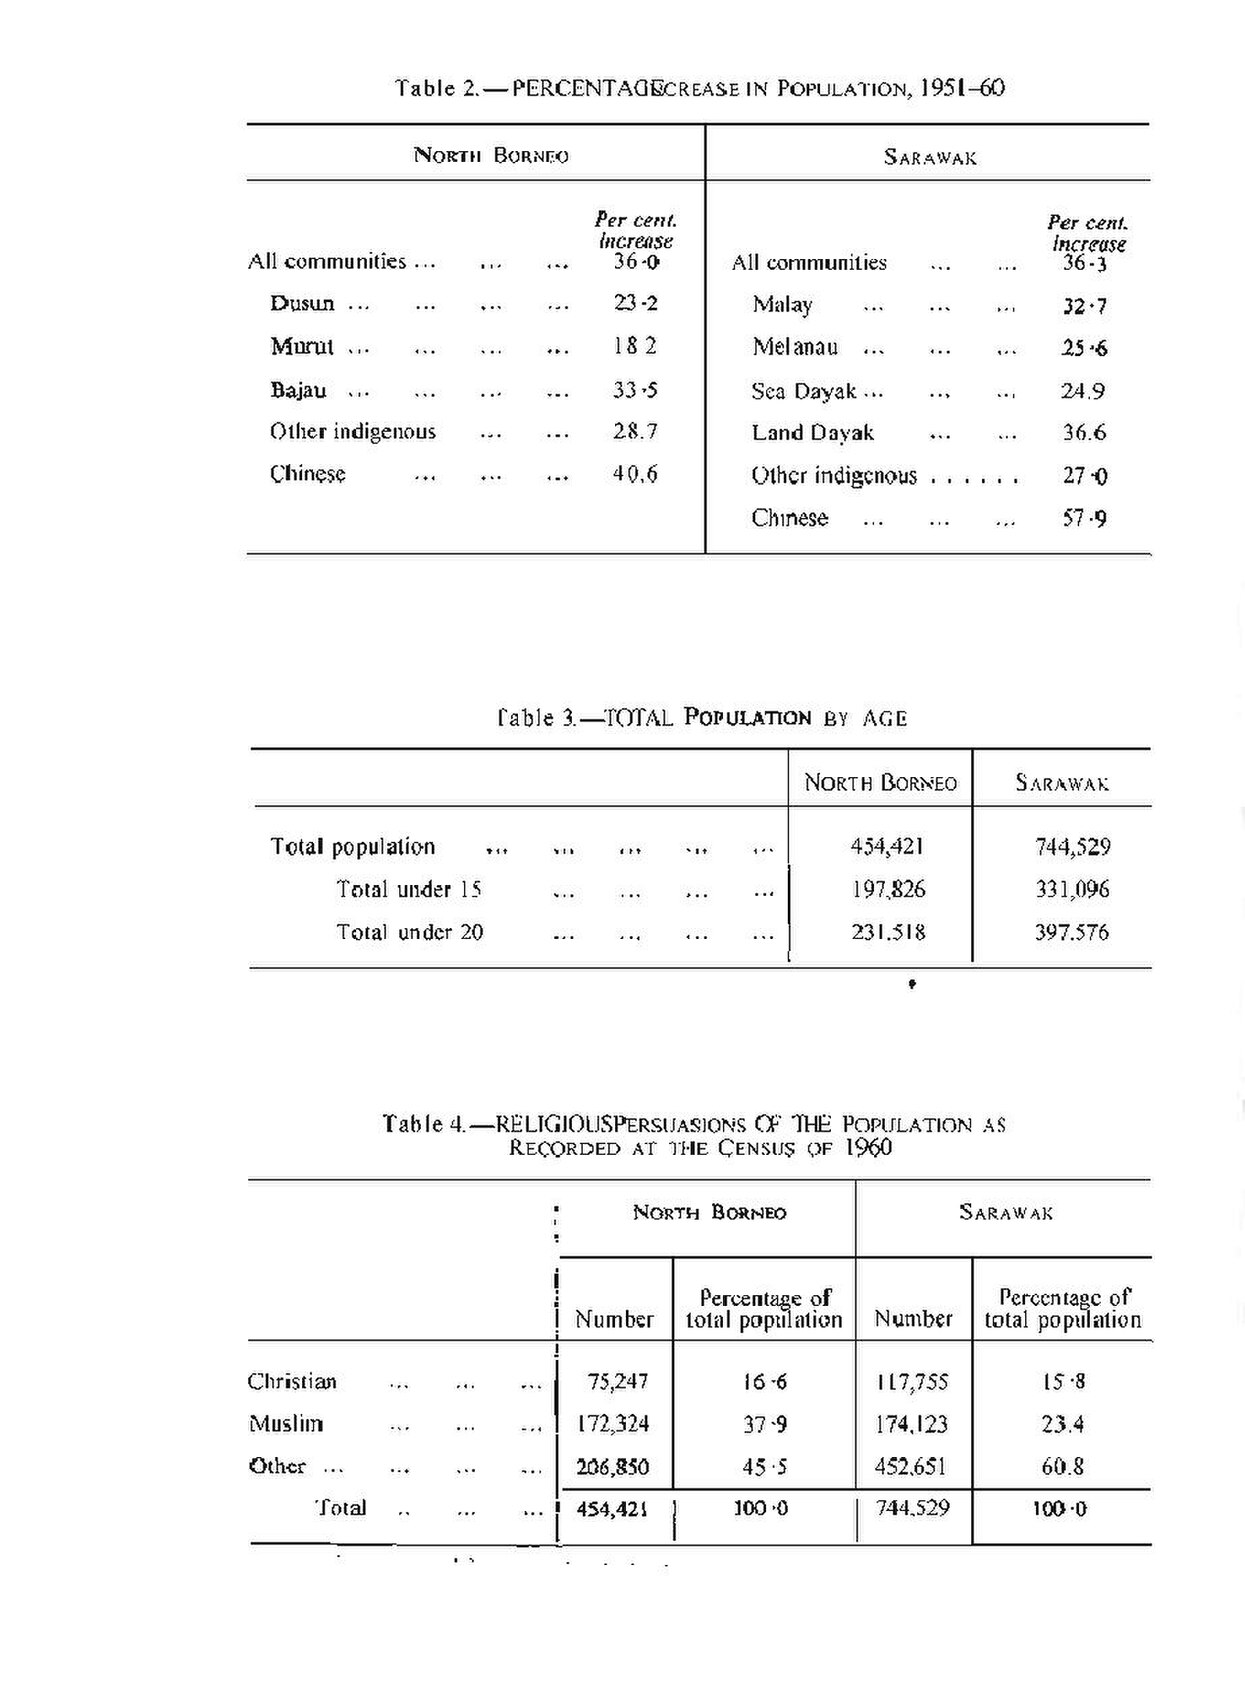
Table 2.——PERCENTAGE INCREASE IN POPULATION, 1951- 60
| NORTH BORNEO | SARAWAK | ||||
|---|---|---|---|---|---|
| Per cent increase |
Per cent increase | ||||
| All communities | .... | 36.0 | All communities | .... | 36.3 |
| Dusun | .... | 23.2 | Malay | .... | 32.7 |
| Murut | .... | 18.2 | Melanau | .... | 25.6 |
| Bajau | .... | 33.5 | Sea Dayak | .... | 24.9 |
| Other indigenous | .... | 28.7 | Land Dayak | .... | 36.6 |
| Chinese | .... | 40.6 | Other indigenous | .... | 27.0 |
| Chinese | .... | 57.9 | |||
Table 3.——TOTAL POPULATION BY AGE
| NORTH BORNEO | SARAWAK | ||
|---|---|---|---|
| Total population | .... | 454,421 | 744,529 |
| Total under 15 | .... | 197,826 | 331,096 |
| Total under 20 | .... | 231,518 | 397,576 |
Table 4.——RELIGIOUS PERSUASIONS OF THE POPULATION AS
RECORDED AT THE CENSUS OF 1960
| NORTH BORNEO | SARAWAK | ||||
|---|---|---|---|---|---|
| Number | Percentage of total population |
Number | Percentage of total population | ||
| Christian | .... | 75,247 | 16.6 | 117,755 | 15.8 |
| Muslim | .... | 172,324 | 37.9 | 174,123 | 23.4 |
| Other | .... | 206,850 | 45.5 | 452,651 | 60.8 |
| Total | .... | 454,421 | 100.0 | 744,529 | 100.0 |
