Assessing the accuracy and quality of Wikipedia entries compared to popular online encyclopaedias/Section 4
4. Data Coding and Analysis
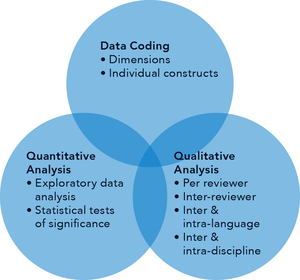
Fig. 4.1 depicts the processes relating to the coding of the data from the articles reviews, and the methods of quantitative and qualitative analysis employed.

Fig. 4.1 Schematic depiction of the data coding and analysis process.
4.1 Data Coding
Data coding was carried out for the purpose of analysis and interpretation. The individual characteristics of each article commented upon by the reviewers (known as constructs) were collapsed into the five key dimensions as follows:
Accuracy:
This dimension represents the precision and correctness of the content of the article. It is computed by averaging the scores for validity, completeness, relevance, neutrality and currency.
References:
This represents the extent to which the article is adequately researched and referenced. It is calculated by averaging the scores for breadth and quality of references.
Style/ Readability:
Style/ readability represents the style and organisation of the article and the quality of the language, grammar, punctuation and visual aids used (if any). This dimension is computed by calculating the mean of the scores on conciseness, language, spelling and grammar, readability, enjoyment, clarity and organisation, coherence, photographs and pictures.
Overall Judgment:
This dimension represents the overall opinion of the reviewer and is computed by averaging the scores ranking the article's citability in an academic and non-academic piece of work. Citability was chosen to represent the reviewer's overall judgment of the article, as it was believed that a reviewer who considered an article to be of poor quality would be less likely to cite the article as compared to an article that he/ she considered to be of high quality. Citability was rated as cite worthy (1) and not cite worthy (0) and the score was averaged, thereby yielding a range from 0 to 1.
Overall Quality Score:
The overall quality score summarises the reviewer's opinion on the overall quality of the article. This is obtained by averaging the scores on the preceding four dimensions, i.e. accuracy, references, style/ readability and overall judgment.
Accuracy, references, style/ readability, overall judgment and overall quality scores were calculated per reviewer per article.
4.2 Quantitative Analysis
Fig. 4.2 depicts the stages in the quantitative analysis of the data. All quantitative data analysis was performed using the Statistical Package for Social Sciences version 15 licensed to the University of Oxford, UK. These various stages were carried out in order to explore the viability of arriving at findings about the overall spread of articles, and about distinct aspects of the articles (i.e. different languages and disciplines) that were specifically of interest within the study. The small scale of the present study does, it must be emphasised, mean that these detailed findings should be treated with some caution, but such tentative findings are valuable in indicating possible areas for future enquiry.
| Exploratory Data Analysis |
| Overall comparisons between articles from Wikipedia and the alternative encyclopaedia of choice |
| Comparison between articles from Wikipedia and the alternative encyclopaedia of choice per language |
| Comparisons between articles from Wikipedia and the alternative encyclopaedia of choice per cell i.e. per language and academic discipline |
Fig. 4.2 Stages in quantitative data analysis.
4.3 Qualitative Analysis
Fig. 4.3 depicts the stages in qualitative analysis.
| Blind analysis by subject |
|
| Key |
|
| Commonalities |
|
| Subject domains |
|
| Languages |
|
Fig. 4.3 Stages in qualitative analysis.
The process of qualitative analysis followed the processes of reduction and display as recommended by Miles and Huberman, in their sourcebook on Qualitative Data Analysis (1994, Sage). Qualitative data were first of all summarised and compiled into spreadsheets for ease of comparison and analysis notes were written and revised over a period of time by reviewers in order to search for patterns, anomalies and illustrative examples. There was no question of using quantifiable content analysis on material such as this, given the fact that much of the language used had been generated by us in creating the criteria to be considered in the reviewer materials. Thus, it was the task of the qualitative data analysis to make interpretive judgments about salient themes and patterns, through repeated reading of the data followed by exploratory attempts at writing coherent and descriptions of results justifiable by substantial and wide-ranging use of illustrative material from the original raw data.