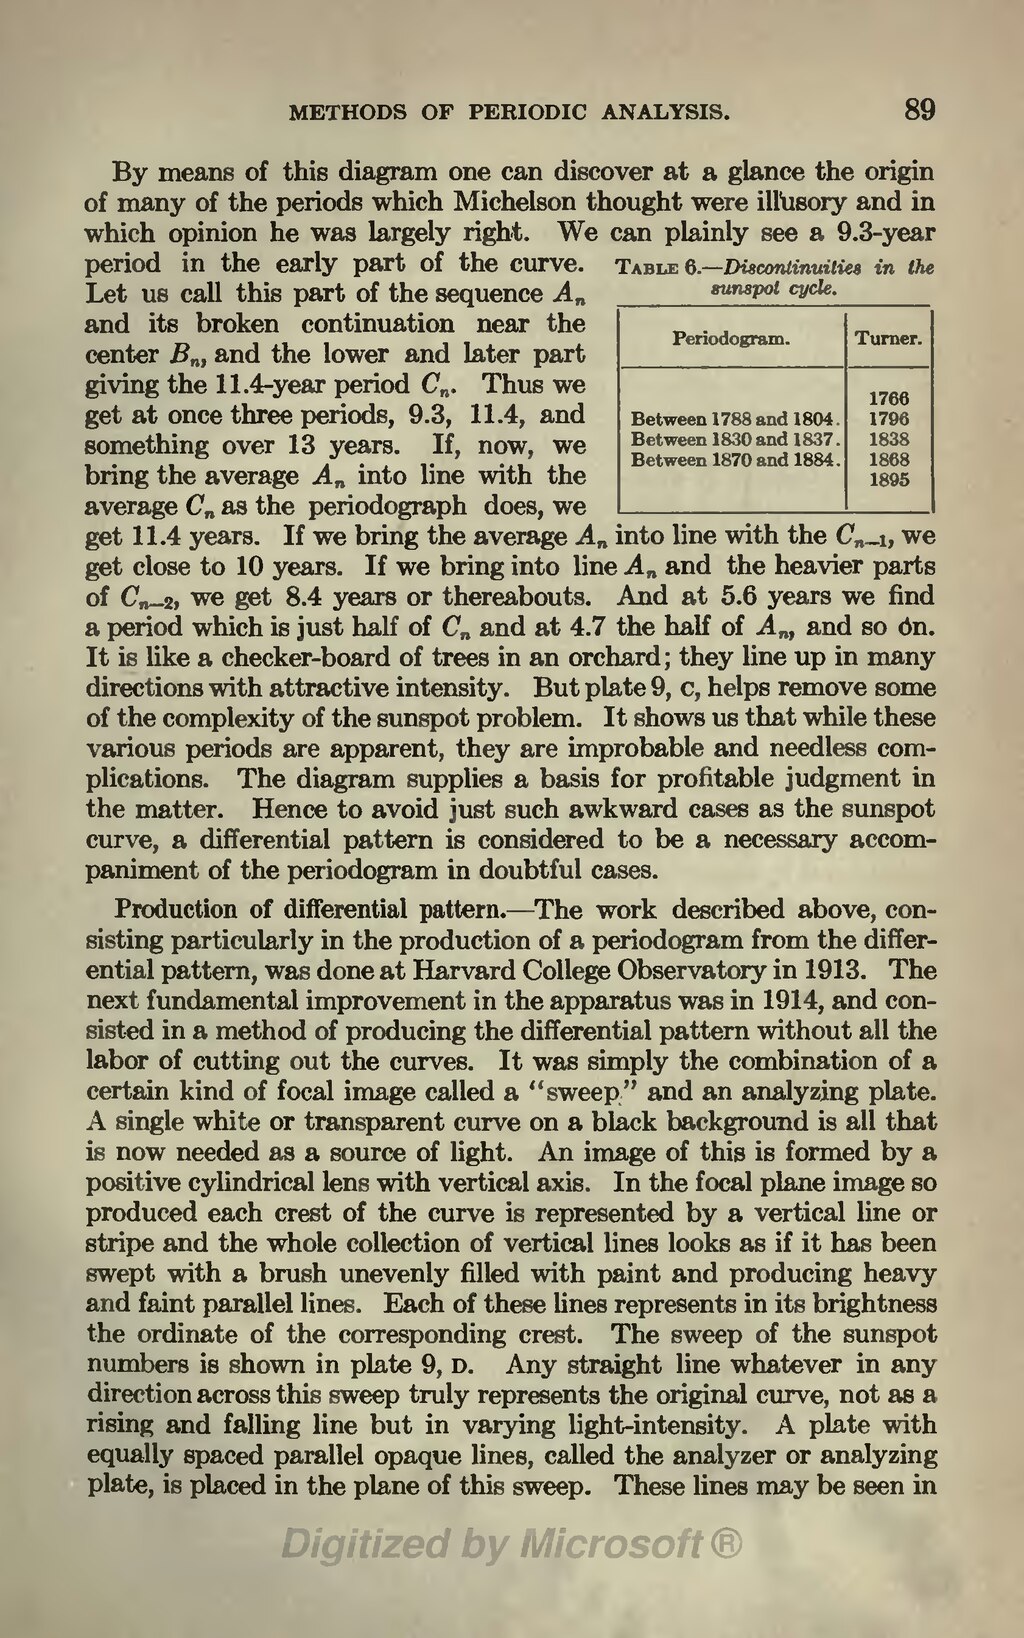
Table 6.—Discontinuities in the sunspot cycle.
| Periodogram. | Turner. |
| 1766 | |
| Between 1788 and 1804. | 1796 |
| Between 1830 and 1837. | 1838 |
| Between 1870 and 1884. | 1868 |
| 1895 |
By means of this diagram one can discover at a glance the origin of many of the periods which Michelson thought were illusory and in which opinion he was largely right. We can plainly see a 9.3-year period in the early part of the curve. Let us call this part of the sequence An and its broken continuation near the center Sn, and the lower and later part giving the 11.4-year period Cn. Thus we get at once three periods, 9.3, 11.4, and something over 13 years. If, now, we bring the average An into line with the average Cn as the periodograph does, we get 11.4 years. If we bring the average An-1 into line with the Cn-1, we get close to 10 years. If we bring into line An and the heavier parts of Cn-2, we get 8.4 years or thereabouts. And at 5.6 years we find a period which is just half of Cn and at 4.7 the half of An, and so on. It is like a checker-board of trees in an orchard; they line up in many directions with attractive intensity. But plate 9, c, helps remove some of the complexity of the sunspot problem. It shows us that while these various periods are apparent, they are improbable and needless complications. The diagram supplies a basis for profitable judgment in the matter. Hence to avoid just such awkward cases as the sunspot curve, a differential pattern is considered to be a necessary accompaniment of the periodogram in doubtful cases.
Production of differential pattern.—The work described above, consisting particularly in the production of a periodogram from the differential pattern, was done at Harvard College Observatory in 1913. The next fundamental improvement in the apparatus was in 1914, and consisted in a method of producing the differential pattern without all the labor of cutting out the curves. It was simply the combination of a certain kind of focal image called a "sweep" and an analyzing plate. A single white or transparent curve on a black background is all that is now needed as a source of light. An image of this is formed by a positive cylindrical lens with vertical axis. In the focal plane image so produced each crest of the curve is represented by a vertical line or stripe and the whole collection of vertical lines looks as if it has been swept with a brush unevenly filled with paint and producing heavy and faint parallel lines. Each of these lines represents in its brightness the ordinate of the corresponding crest. The sweep of the sunspot numbers is shown in plate 9, d. Any straight line whatever in any direction across this sweep truly represents the original curve, not as a rising and falling line but in varying light-intensity. A plate with equally spaced parallel opaque lines, called the analyzer or analyzing plate, is placed in the plane of this sweep. These lines may be seen in