But we do not need theorizing so much as facts, which should be secured without delay. In the papers quoted above I have shown that it is possible to transform a qualitative series into one giving measures of differences. If the same thousand examination papers were read and graded independently by ten examiners, the variation in the grades of the same paper by different examiners would give us a measure of the differences between the papers, which would be inversely as the variation of the grades. I have in this way made a curve for the distribution of scientific performance in a selected group, and the same methods should be applied to merit in examinations.
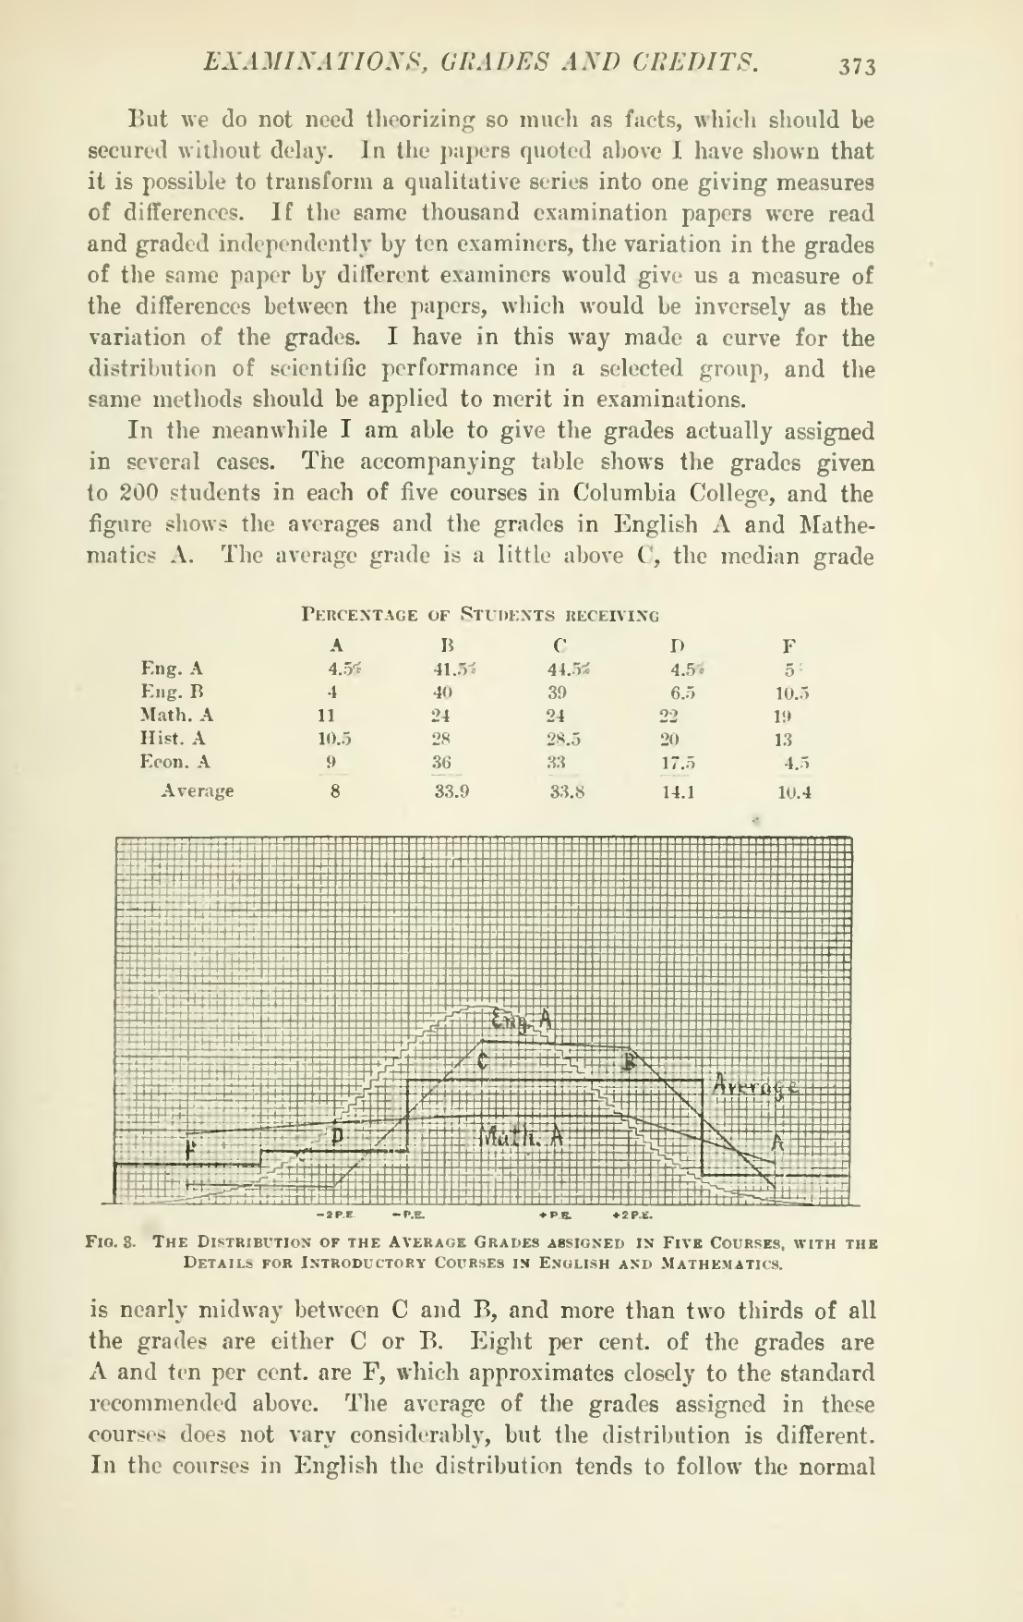
In the meanwhile I am able to give the grades actually assigned in several cases. The accompanying table shows the grades given to 200 students in each of five courses in Columbia College, and the figure shows the averages and the grades in English A and Mathematics A. The average grade is a little above C, the median grade
Percentage of Students receiving
| A | B | C | D | F | ||||||
| Eng. A | 4 | .5% | 41 | .5% | 44 | .5% | 4 | .5% | 5 | % |
| Eng. B. | 4 | 40 | 39 | 6 | .5 | 10 | .5 | |||
| Math A. | 11 | 24 | 24 | 22 | 19 | |||||
| Hist. A. | 10 | .5 | 28 | 28 | .5 | 20 | 13 | |||
| Econ. A | 9 | 36 | 33 | 17 | .5 | 4 | .5 | |||
| Average | 8 | 33 | .9 | 33 | .8 | 14 | .1 | 10 | .4 |

is nearly midway between C and B, and more than two thirds of all the grades are either C or B. Eight per cent, of the grades are A and ten per cent, are F, which approximates closely to the standard recommended above. The average of the grades assigned in these courses does not vary considerably, but the distribution is different. In the courses in English the distribution tends to follow the normal