COMPARATIVE TABLES.
xxxi
A table should appear at this position in the text. See Help:Table for formatting instructions. |
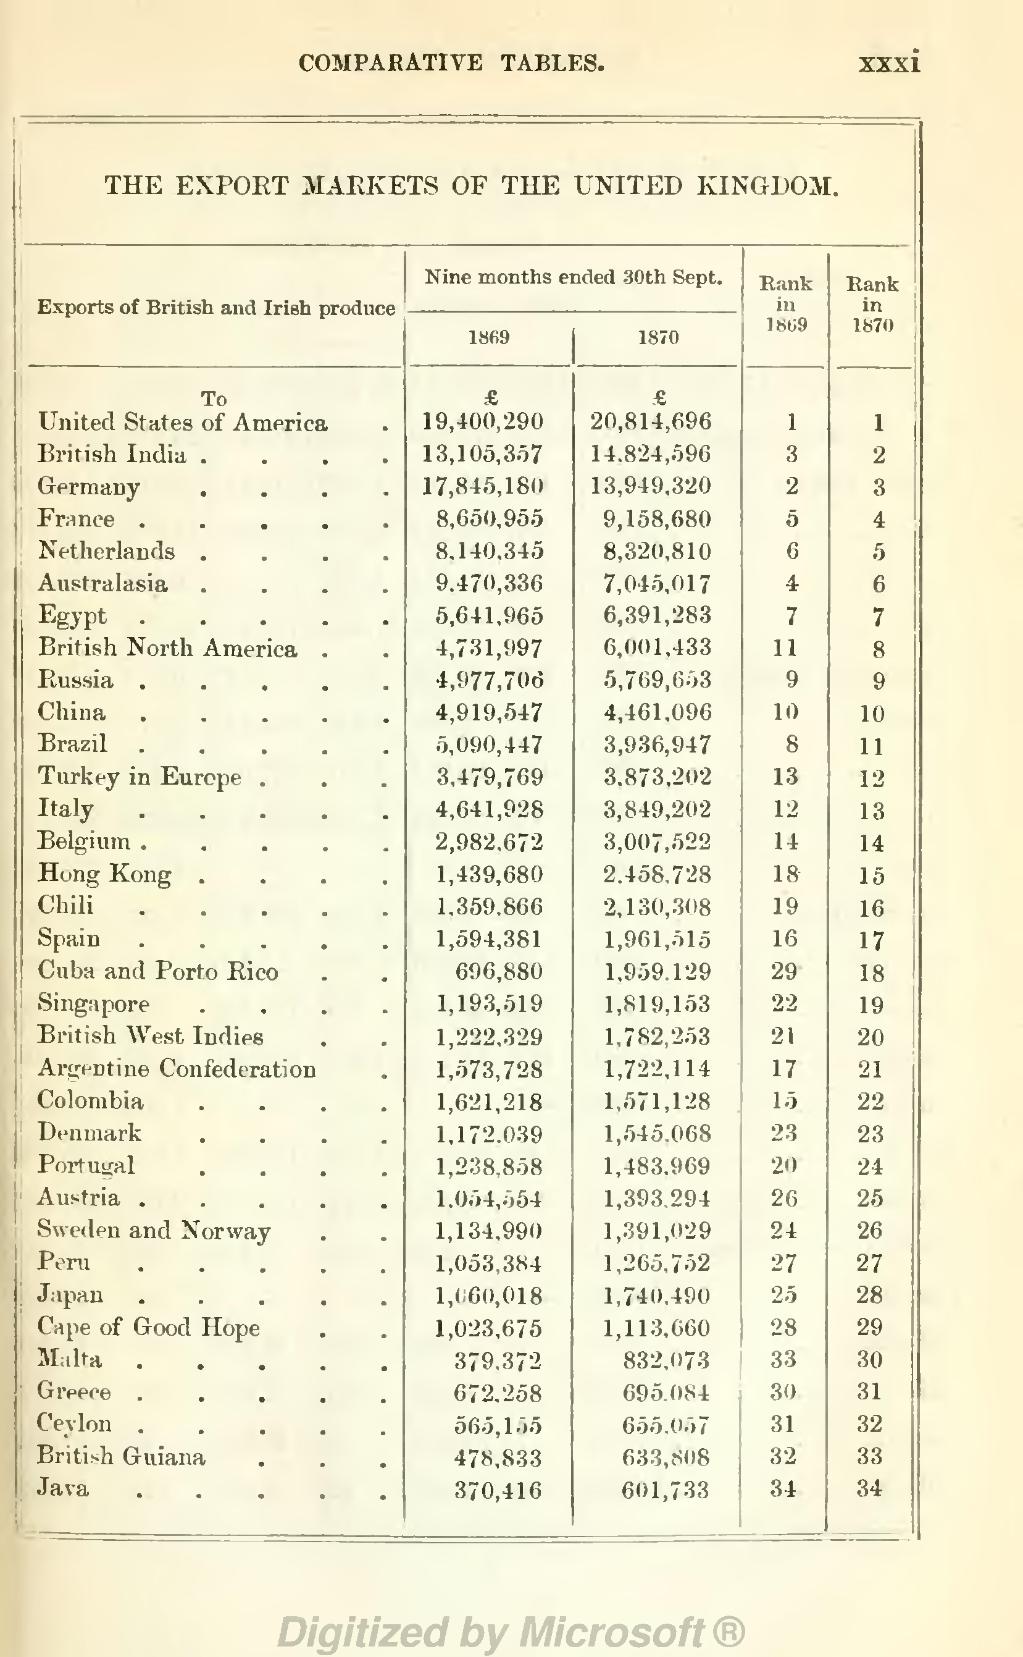
THE EXPORT MARKETS OF THE
UNITED KINGDOM
Nine months ended 30th Sept.
Rank
Rank
Exports of British and Irish produce
in
in
1869
1870
1869
1870
To
&
&
United States of America
19,400,290
20,814,696
1
1
British India ....
13,105,357
14,824,596
3
2
Germany
17,845,180
13,949,320
2
3
France .
8,650,955
9,158,680
5
4
Netherlands .
8,140,345
8,320,810
6
5
Australasia
9,470,336
7,045,017
4
6
Egypt .
5,641,965
6,391,283
7
7
British North America
4,731,997
6,001,433
11
8
Russia .
4,977,706
5,769,653
9
9
China
4,919,547
4,461,096
10
10
Brazil
5,090,447
3,936,947
8
11
Turkey in Europe .
3,479,769
3,873,202
13
12
Italy
4,641,928
3,849,202
12
13
Belgium .
2,982,672
3,007,522
14
14
Hong Kong .
1,439,680
2,458,728
18
15
Chili .
1,359,866
2,130,308
19
16
Spain
1,594,381
1,961,515
16
17
Cuba and Porto Rico
696,880
1,959.129
29
18
Singapore
1,193,519
1,819,153
22
19
British West Indies
1,222,329
1,782,253
21
20
Argentine Confederation
1,573,728
1,722,114
17
21
Colombia
1,621,218
1,571,128
15
22
Denmark
1,172,039
1,545.068
23
23
Portugal
1,238,858
1,483,969
20
24
Austria .
1,054,554
1,393,294
26
25
Sweden and Norway
1,134,990
1,391,029
24
26
Peru
1,053,384
1,265,752
27
27
J Japan
1,060,018
1,740,490
25
28
Cape of Good Hope
1,023,675
1,113,660
28
29
Malta .
379,372
832,073
33
30
! Greece . . .
672,258
695.084
30
31
Ceylon .
565,155
655,0-">7
31
32
British Guiana
478,833
633, Si IS
32
33
' Java
370,416
601,733
34
34